
Tools · macOS app
Audio Doctor
Render audio through plugins offline, then get analysis charts and data.
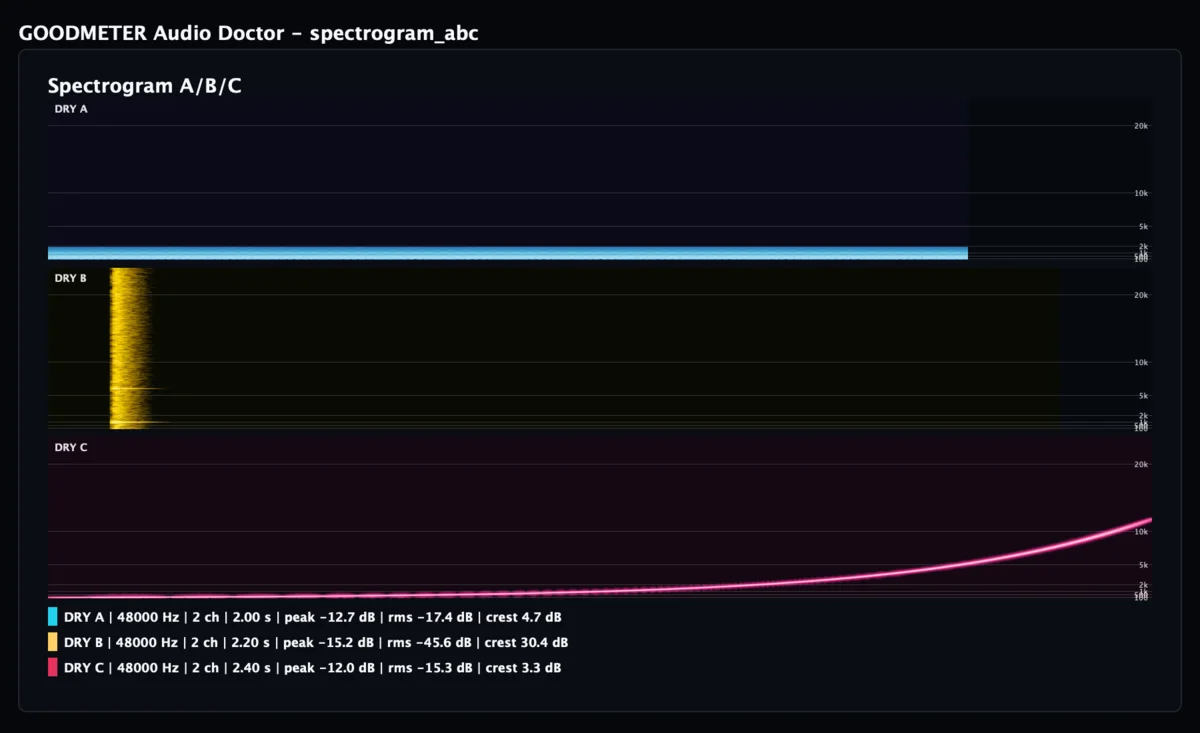
Import audio, load plugins and render offline, then export the spectrum, dynamics and spatial relationships of the sound as charts and data. A copy is kept from before and after processing, so it’s easy to compare how much the sound changed and to put the charts into a project or research material. This is a separate app and is not included with GOODMETER.
macOS 14.2 or later · Apple silicon · 10.6 MB
Workflow
Everything from plugin processing to analysis results is done offline.
-
Audio and plugins
Import or generate test audio, pick plugins and settings, and set up the before and after comparison.
-
Offline rendering
Run the processing and save the output. Compare different settings on the same input.
-
Analysis from several angles
Look at the spectrum, spectrogram, envelope, dynamics and spatial impression.
-
Charts and data
Export PNG, CSV and analysis logs, with each processing condition matched to its result.
Specs
v1.0.3
- Type
- macOS app
- System
- macOS 14.2 or later
- Processor
- Apple silicon (arm64)
- Export
- PNG charts, CSV data, analysis logs
- Installer
- Disk image (.dmg) containing only Audio Doctor.app
Need real-time meters? That’s GOODMETER, a separate app. Download it from its own page.
Download Audio Doctor v1.0.3
Open the .dmg, drag Audio Doctor.app into your Applications folder, then open it from Applications or Spotlight.